Original research · August 19, 2026
How to Follow Sharp Money on Player Props
By Matt Downs
Sharp money is not a mystical signal. It is large, trackable bets placed by people who price a market before they bet it. When several of them pay a worse price than the one still on your screen, that gap is information you can act on.
Here is one complete example from 18 August 2026, shown start to finish: the flag, the ladder of real bets behind it, the counter-evidence on the same screen, and how the play graded that night. Every number below was visible before first pitch.
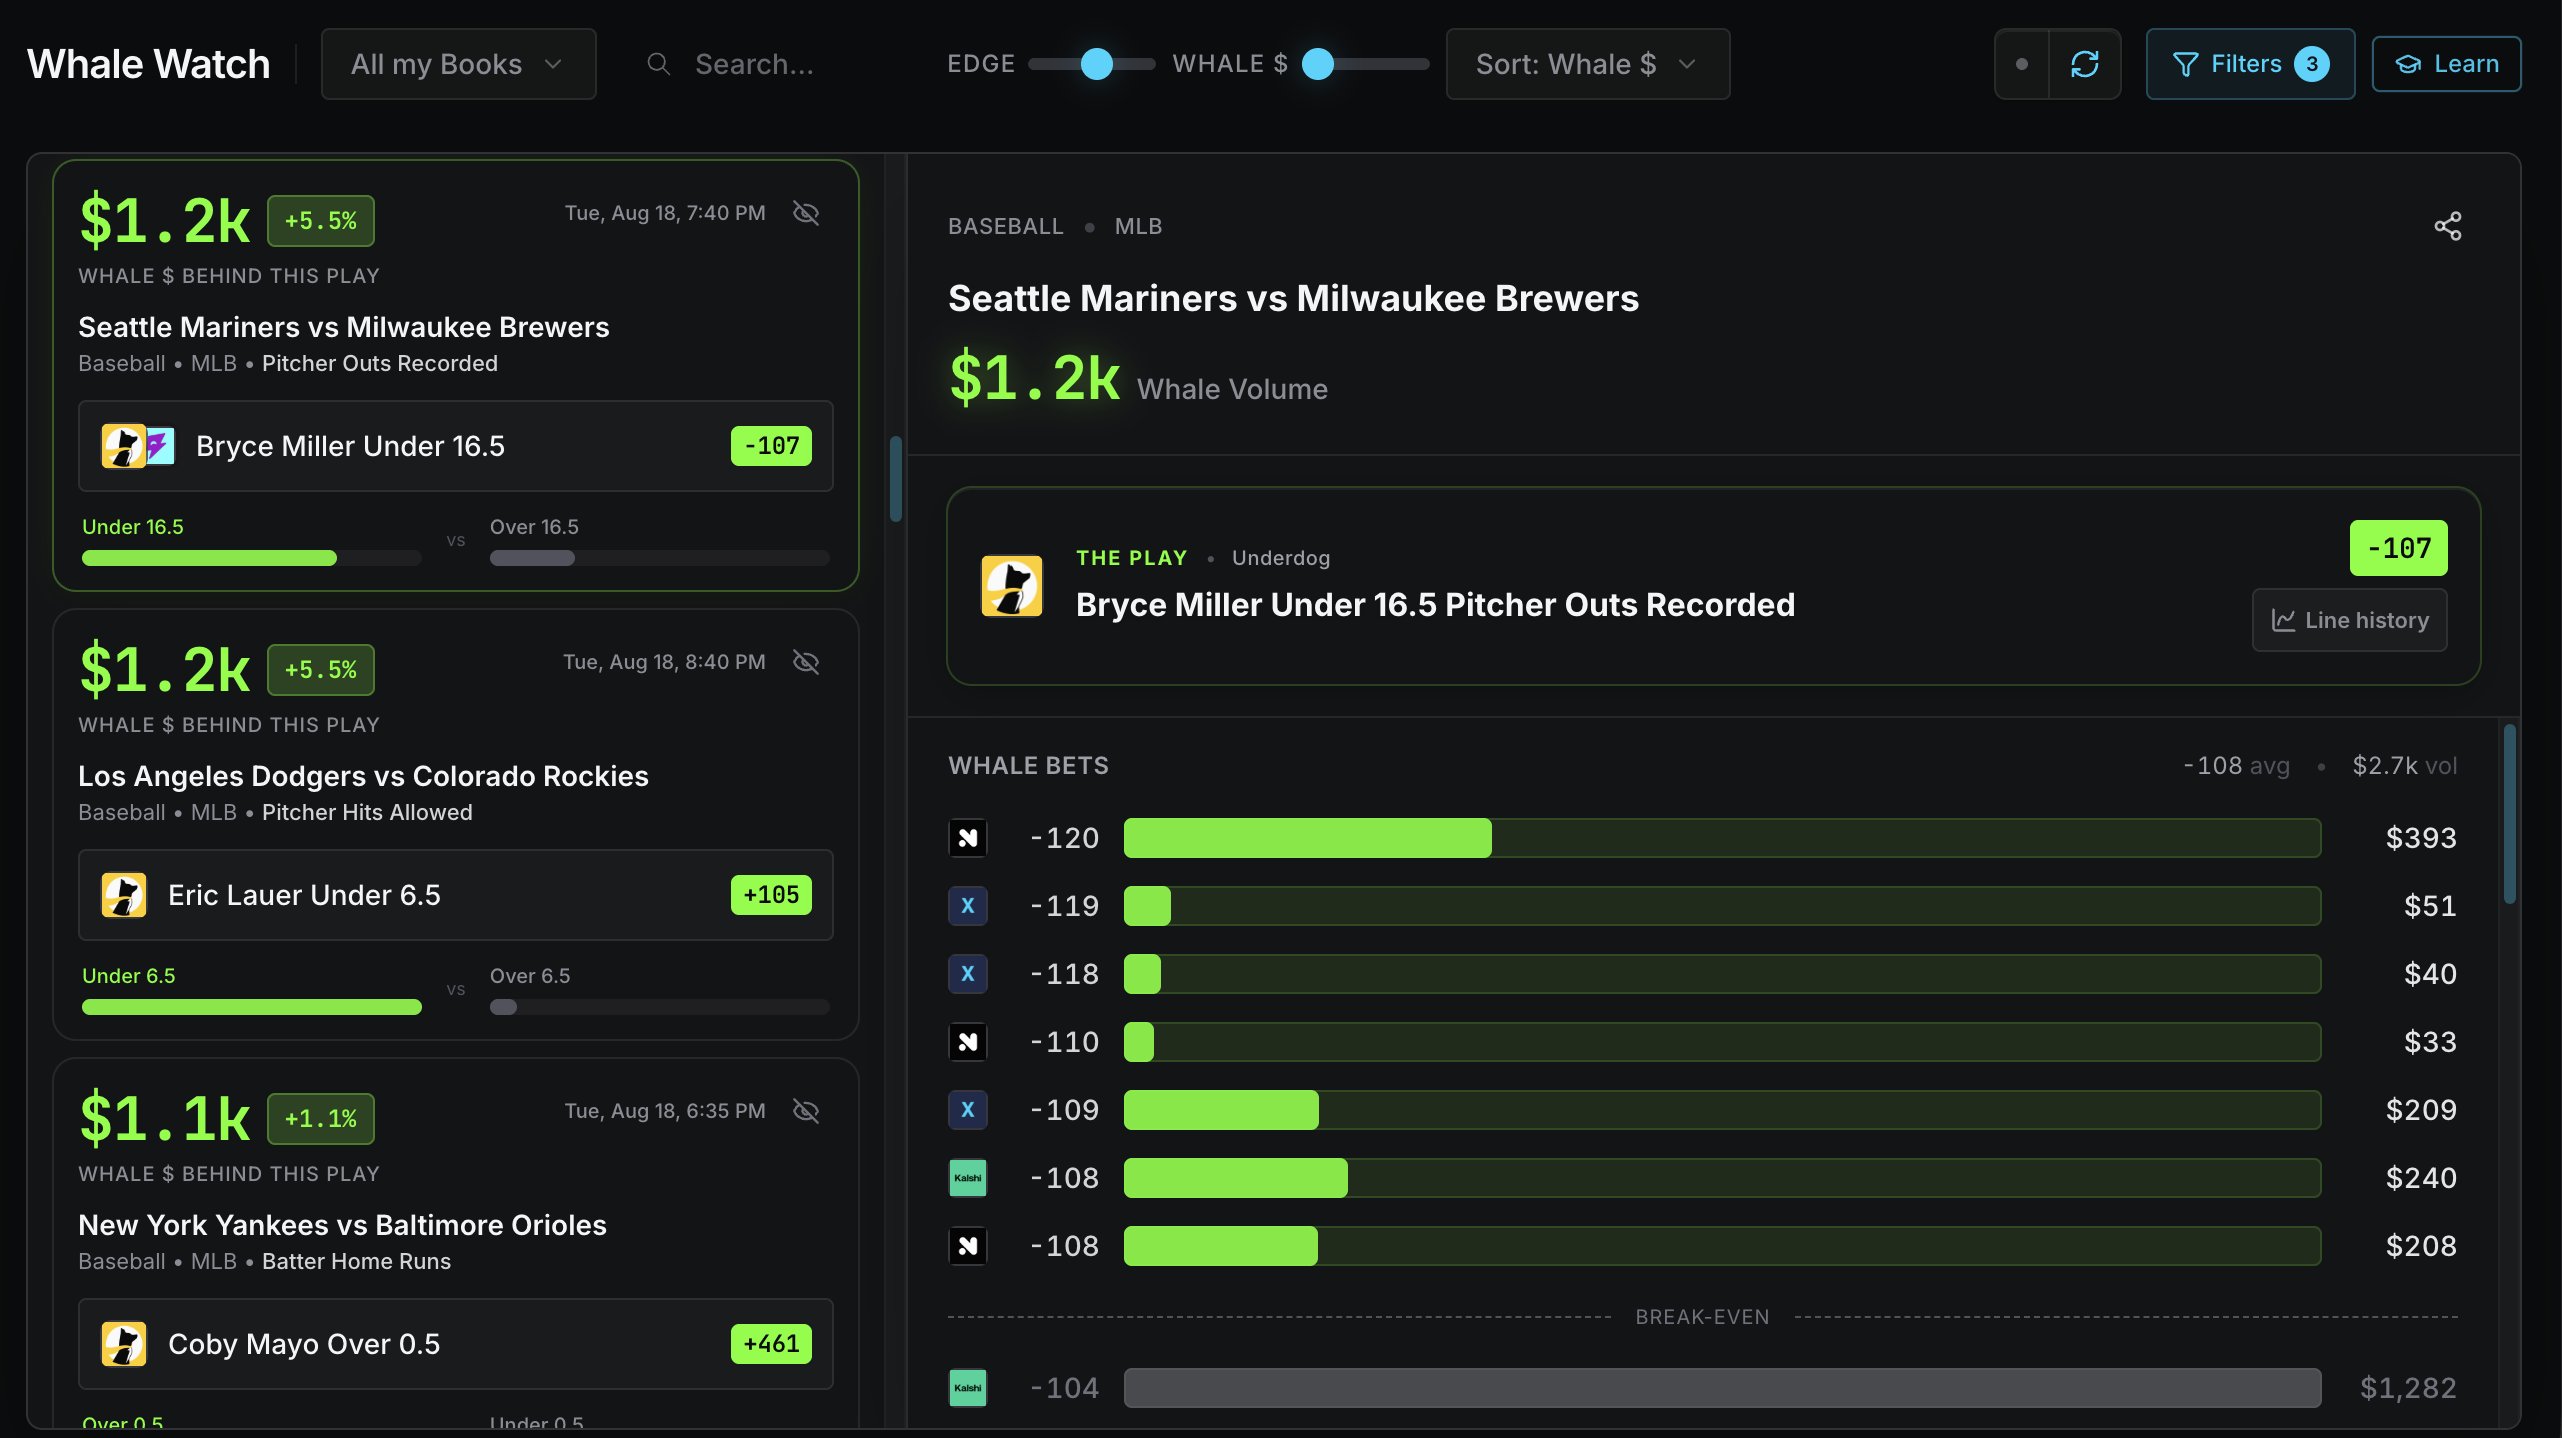
The flag: Bryce Miller under 16.5 pitching outs
At 7:40pm ET on 18 August, our whale tracker flagged Bryce Miller under 16.5 pitching outs, Mariners at Brewers. Underdog was selling the under at -107, which demands 51.69 percent to break even.
The ladder on the right side of the screen is the whole argument. Seven tracked large bets sat on that same under: 393 dollars at -120, then more at -119, -118, -110, -109, and two at -108, about 1,174 dollars in total, averaging -108. Every one of those bettors paid a worse price than the -107 still on the board. The tool put the edge at plus 5.5 percent, its own devigged figure.
When someone puts real money down at -120 on a market you can still buy at -107, they are telling you what they think the number is worth. You are being offered the same position at a discount to what informed money already paid.
The ladder against the board price
| Underdog price, still live | -107 | 51.69% break-even |
|---|---|---|
| Tracked whale bets on the under | -108 to -120 | about $1,174 across seven bets |
| Whale average price | -108 | everyone paid more than -107 |
| Money below break-even | $1,282 at -104 | the counter-evidence, on the same screen |
| Tool's stated edge at -107 | +5.5% | the tool's own devigged figure |
Always read the money below the line
The same screen showed 1,282 dollars sitting at -104, below the break even line. A market is never unanimous, and a screen that only showed the supporting side would be a sales pitch, not a tool.
The read is a lean, weighted by dollars and by price. The biggest bets, at the worst prices, were on the under. Someone with an exchange account and patience could have done slightly better than -107. Both of those things are true at once, and you should want a tool that shows you both.
The same screen carried a second flag that evening: Eric Lauer under 6.5 hits allowed, Dodgers at Rockies, another 1.2 thousand dollars behind it at plus 5.5 percent, priced at +105. Two flags off one screen.
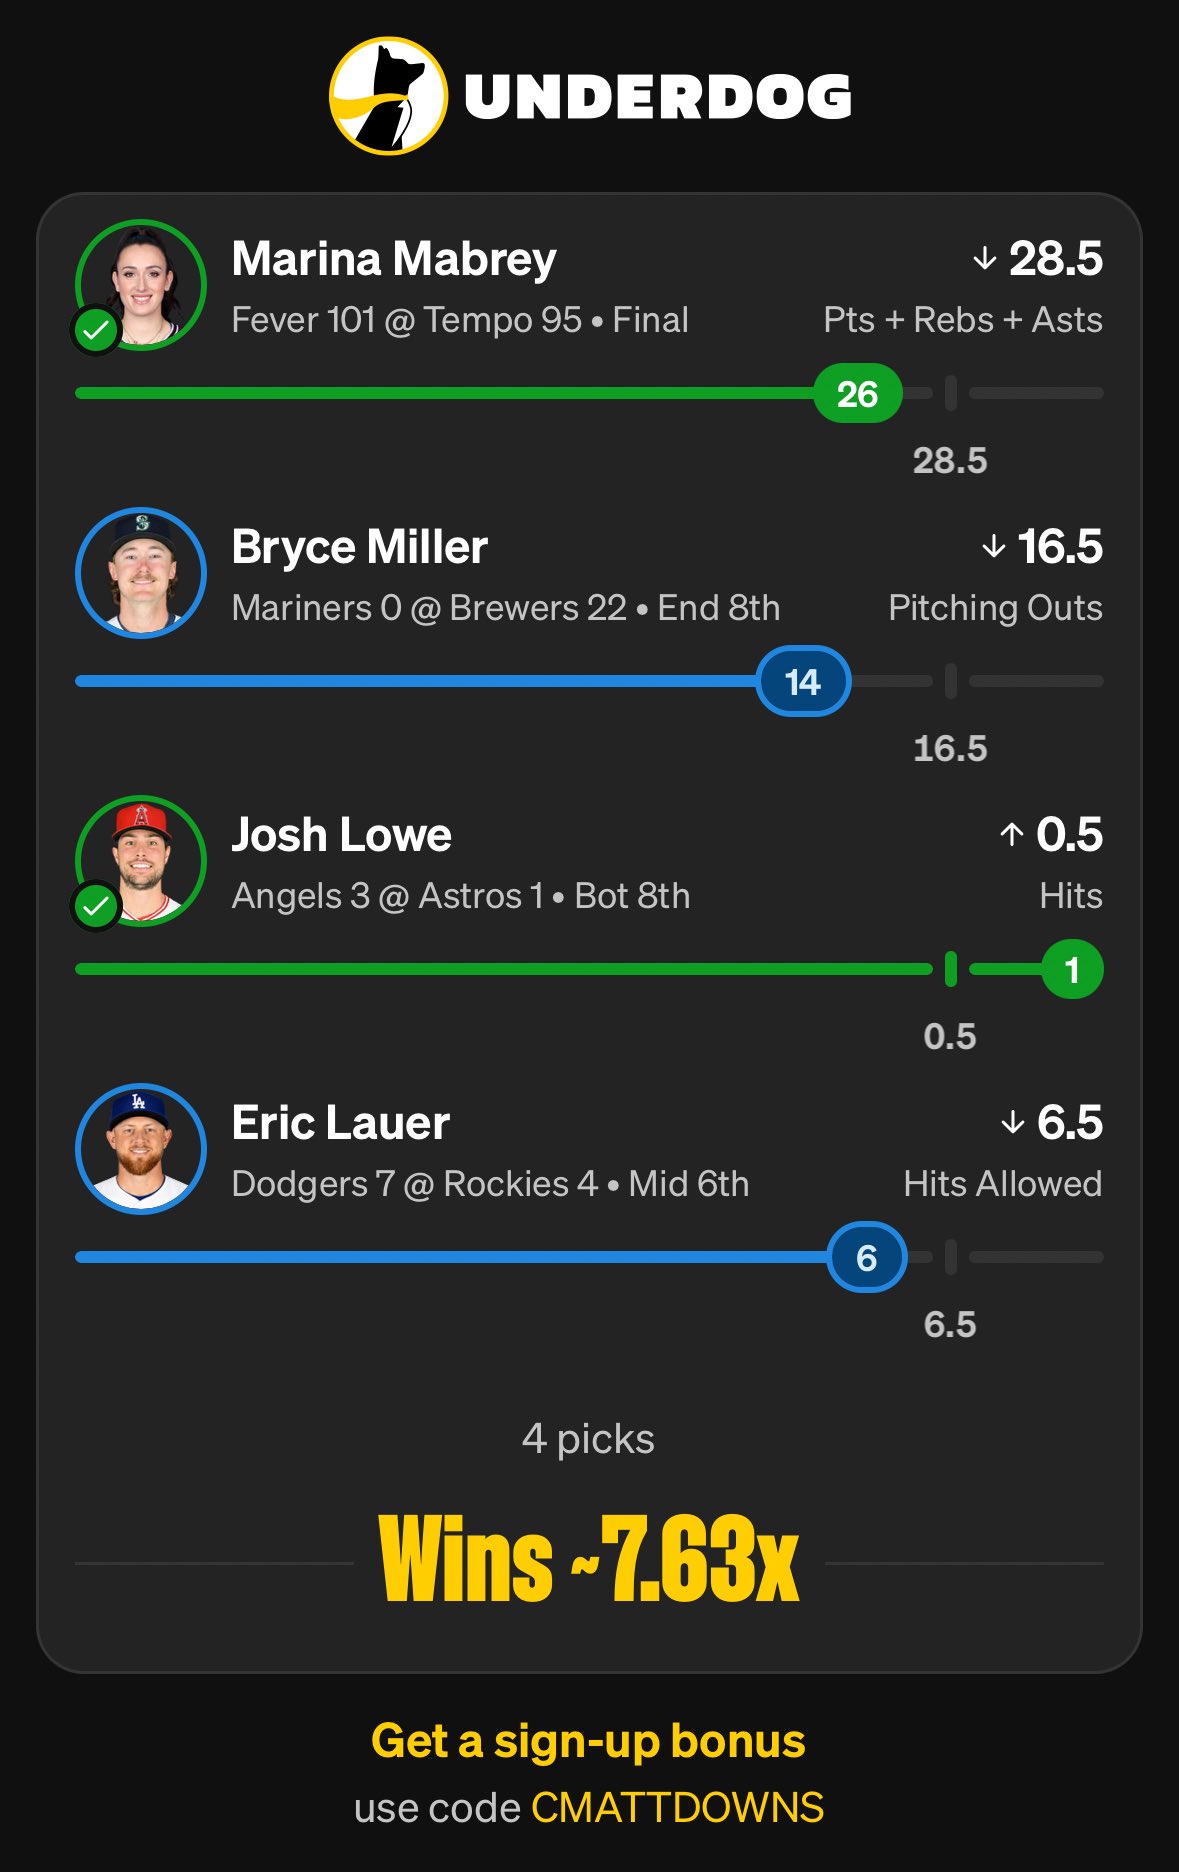
How it graded, and what that does not prove
Miller lasted into the 8th inning and finished at 14 outs recorded, under 16.5 with room. Lauer allowed exactly 6 hits against a 6.5 line. Both flagged legs cleared, the four man card they went on cashed at 7.63x, and it is worth being precise about what that result proves.
A winning night does not validate the process, the same way a losing night would not have refuted it. Any single bet can win at a terrible price or lose at a great one. The part you control, and the only part that compounds over a season, is whether the price you paid demanded less than what the market honestly thought of the number at the time.
On this play, that check was passable by anyone: seven bets of real money said -108 to -120, and the board still said -107.
How to run this check yourself
Convert your app's price to a break even percentage with the free implied odds calculator. Then look the market up on a free odds screen showing every book's price on both sides, and see whether the market's devigged number clears your break even. The EV calculator turns any gap into dollars per hundred.
Tracked whale flags are the paid layer on top of that free check. They do not replace the price math. They tell you when serious money has already done the math and paid more than you are being asked to.
Frequently asked questions
What counts as sharp money on a prop?
Large tracked bets from accounts that consistently price markets before betting them. Size alone is a weak signal. Size at a bad price is the strong one: a bettor who accepts -120 on a market listed at -107 elsewhere has told you what they think the fair number is.
Does following sharp money actually work?
It works as a pricing signal, not as a pick service. On the play shown here, the whale average of -108 against a live -107 meant you could take the identical position cheaper than informed money paid. The play also has to clear your own app's break even, and most plays on any given night clear nothing.
Did this play winning prove the signal was right?
No. The under at 14 outs could have gone over without the math being wrong. The gradeable claim is that -107 was a fair or better price at the moment it was paid, and seven real bets at -108 to -120 supported that before first pitch.
Can I see whale bets for free?
The price check is free: an odds screen showing every book on both sides, plus a break even calculator, covers most of the value. The whale ladder itself, with per book prices and dollar sizes on tracked large bets, is part of the paid tools.