Which Devig Method Is Most Accurate
By Matt Downs · August 30, 2026
When a tool strips the vig out of a sportsbook price and hands you a fair number, how close is that number to the truth? Not in theory. Against results that actually settled.
Almost nobody checks. There are five common ways to remove vig from a two-sided market, one of them is what nearly every calculator on the internet runs, and it has a measurable flaw. We graded all five against 64,670 settled tennis matches with closing prices, and compared every answer to who won.
The short answer
Every no-vig calculator you can find removes the vig the same way, including the free no-vig calculator on this site: it adds the implied probability of both sides, then divides each side by that total. Near a coin flip that is exact. On a -110 / -110 market all five methods return 50.00%, identically rather than approximately.
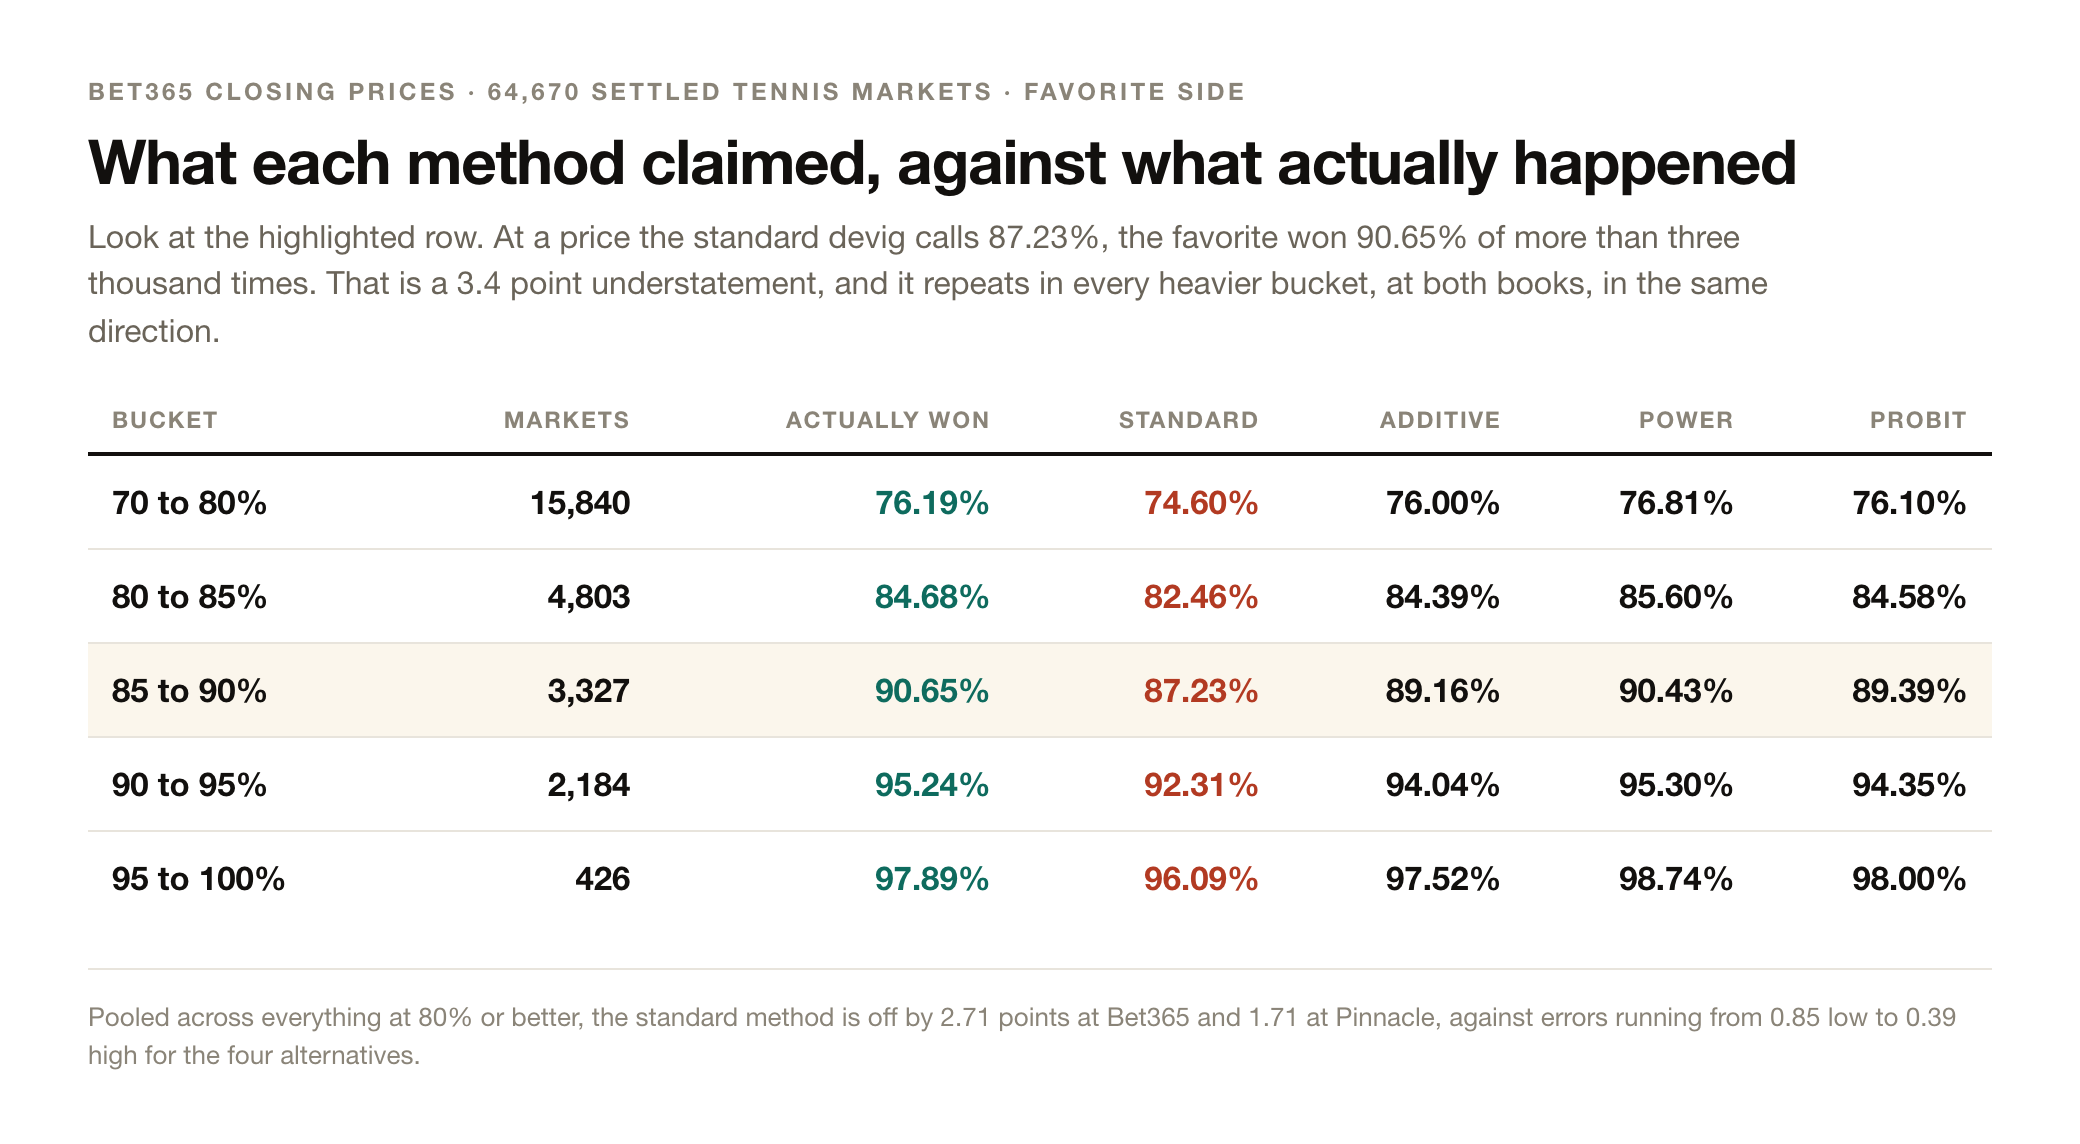
On lopsided prices the standard method breaks in one direction. It understates heavy favorites, which means it overstates longshots by the same amount. Pooled across every market it prices at an 80% favorite or better, it is 2.71 points light at Bet365 and 1.71 points light at Pinnacle. The four alternatives land between 0.85 low and 0.39 high.
That matters because the overstated half is where the money goes. A method that inflates a longshot only ever manufactures expected value that is not there. It never hides a real edge.
Why this was measured on tennis
Tennis is the right instrument and nothing else comes close. It is strictly two outcomes, so there is no draw or third leg to model. Every row carries both players' closing prices from more than one book. And it goes lopsided routinely, because a top seed against a qualifier prices at 95% and up.
That last part is the whole reason. The methods only disagree on lopsided prices, so a sport that never leaves the coin-flip band cannot answer this question at any sample size. Our data source is tennis-data.co.uk, ATP and WTA from 2013 to 2026, free and public: 67,461 matches of which 64,963 completed, with closing odds from Pinnacle (median vig 2.60%) and Bet365 (5.76%).
How big the error actually is
Read the 85 to 90% row. The standard devig says the favorite is an 87.23% shot. Across 3,327 settled markets that favorite won 90.65% of the time. The method is three and a half points light, and it is light in the same direction in every heavier bucket, at both books.
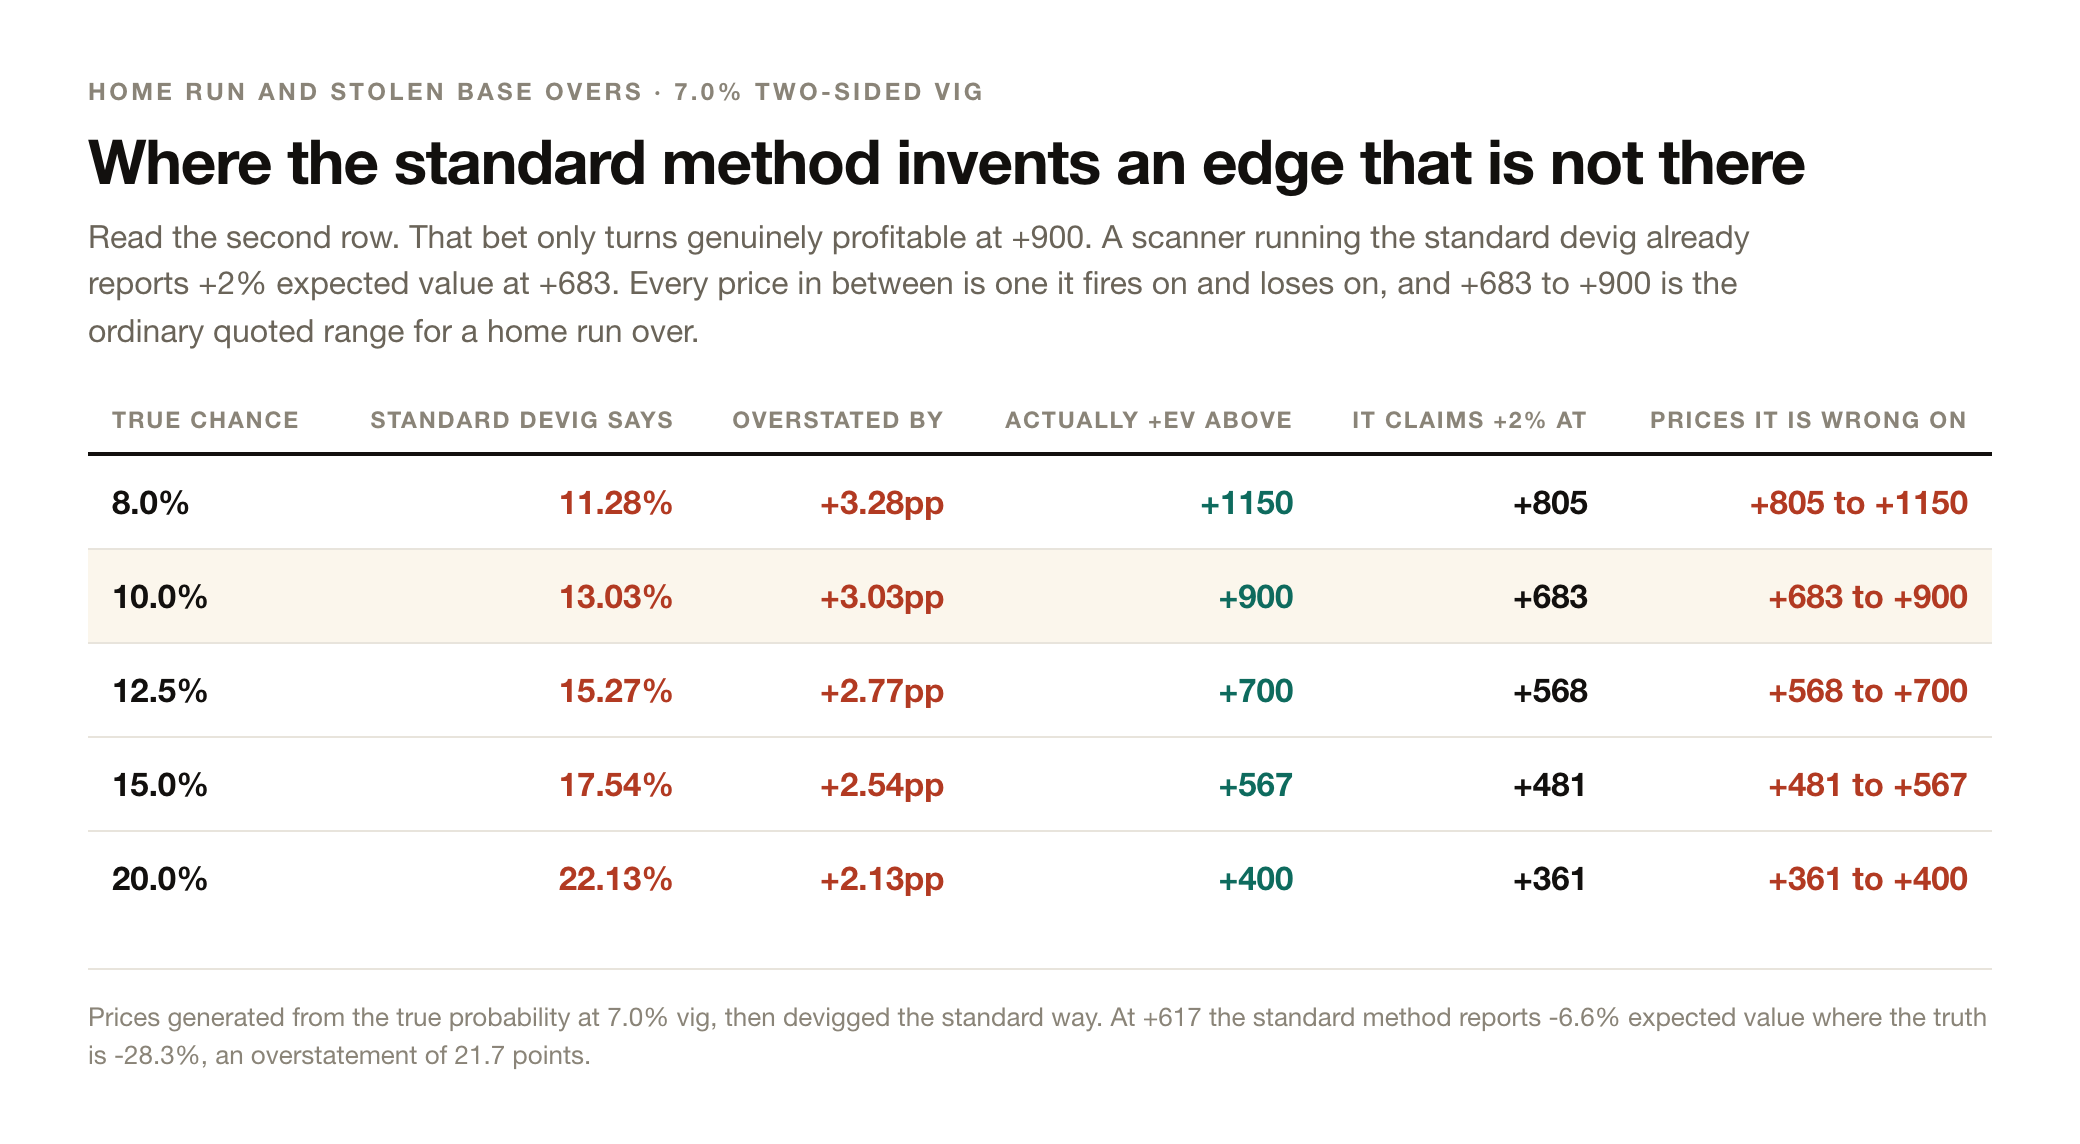
The error scales with the vig, which is the mechanism made visible. Bet365 carries 5.76% vig and shows roughly double the error of Pinnacle's 2.60%. The standard method strips margin in proportion to price, so the longshot keeps too much of it and the favorite gives up too much.
Where a lopsided price actually shows up
This is the part that decides whether any of it is worth acting on. We pulled 50,305 live two-sided prop quotes across MLB, WNBA and NFL on 29 August 2026 and counted where the tails are.
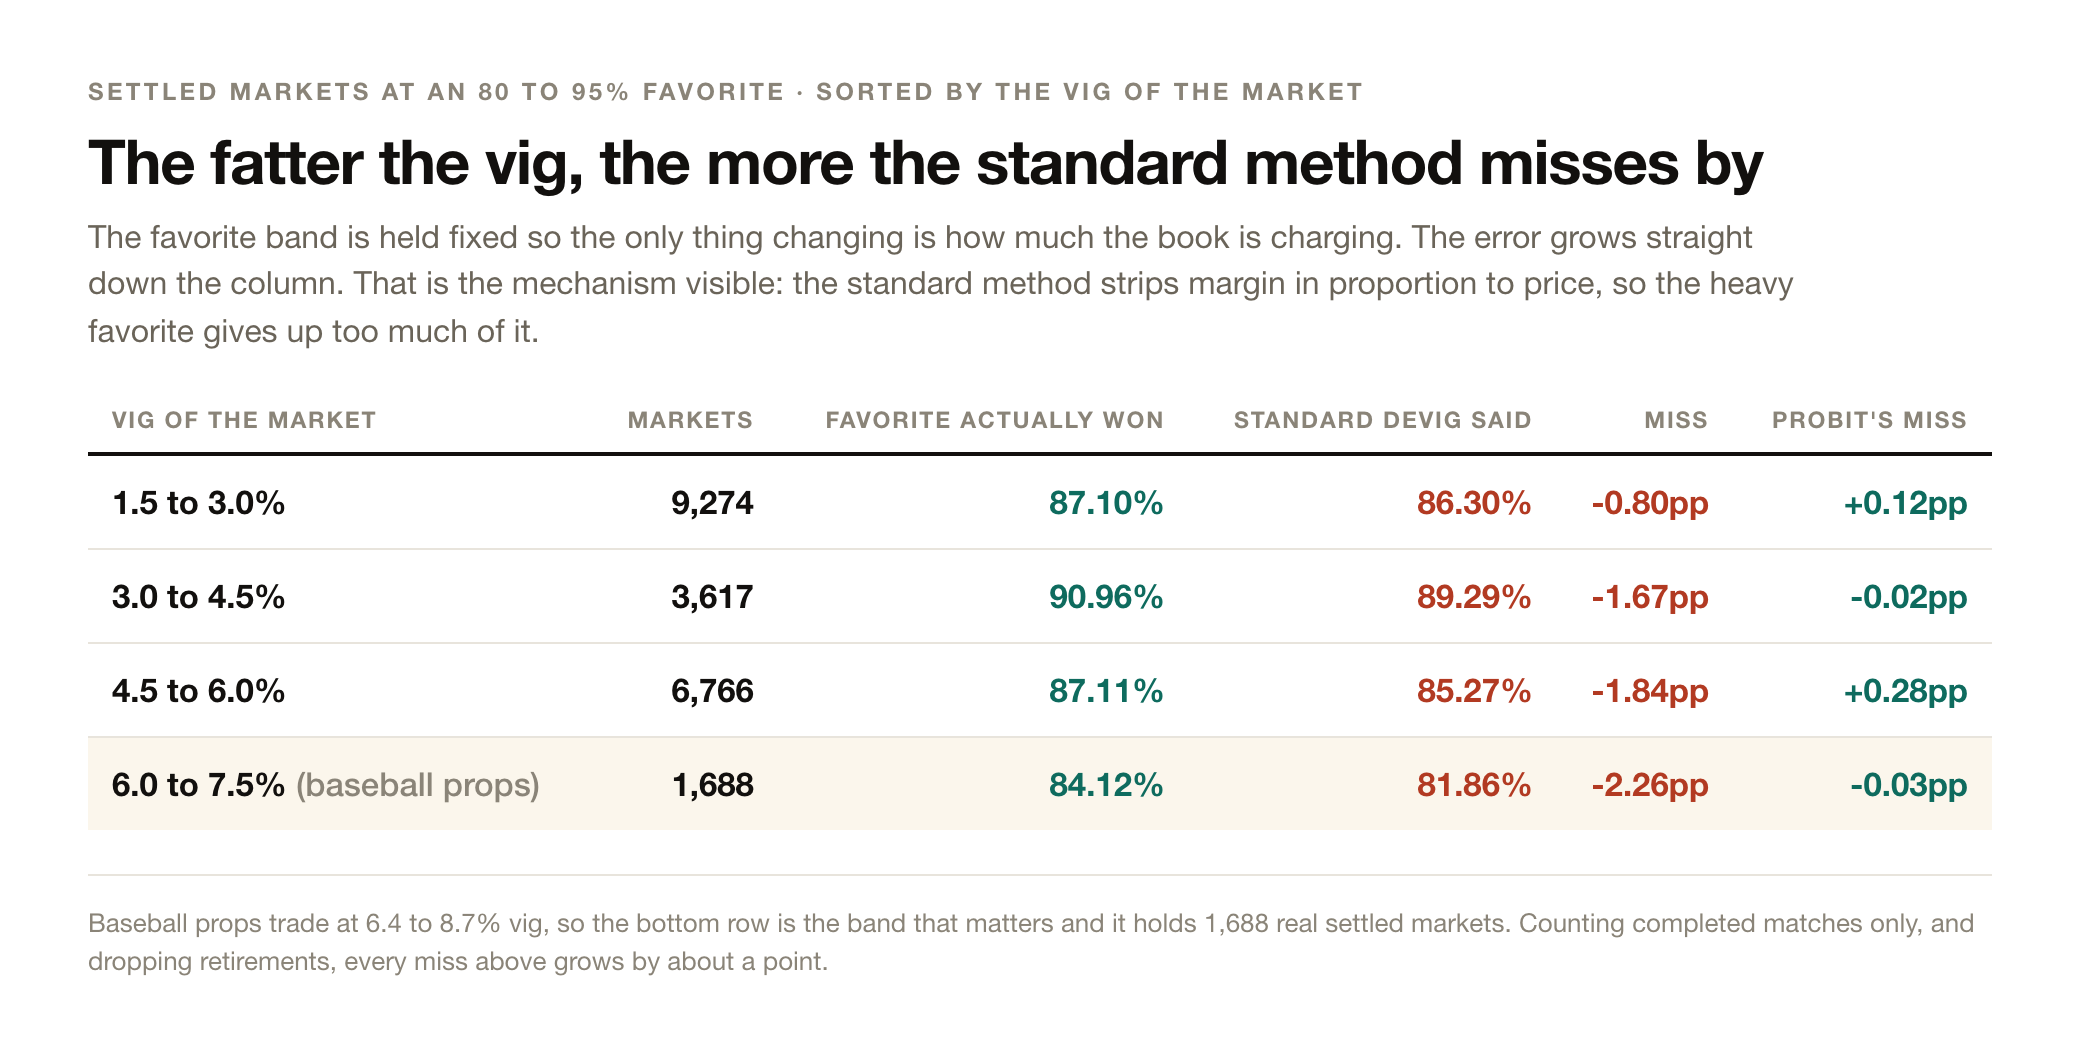
In football, essentially nowhere. 90.5% of NFL prop quotes sit between 50% and 55%, and the whole pull contained one quote at an 80% favorite. A receiving yards line is written at the median on purpose, because a coin flip you pick a side of is the product being sold. WNBA props behave the same way.
Baseball is the exception, and only three markets inside it. Home runs, doubles and stolen bases supply 5,935 of MLB's 6,183 lopsided quotes, because you cannot move a home run line to the median. Over 0.5 home runs is what it is, and its under sits at 80 to 90%.
What the longshot error costs on a real bet
Run the error forward on a home run over, at the 7.0% vig those markets trade at.
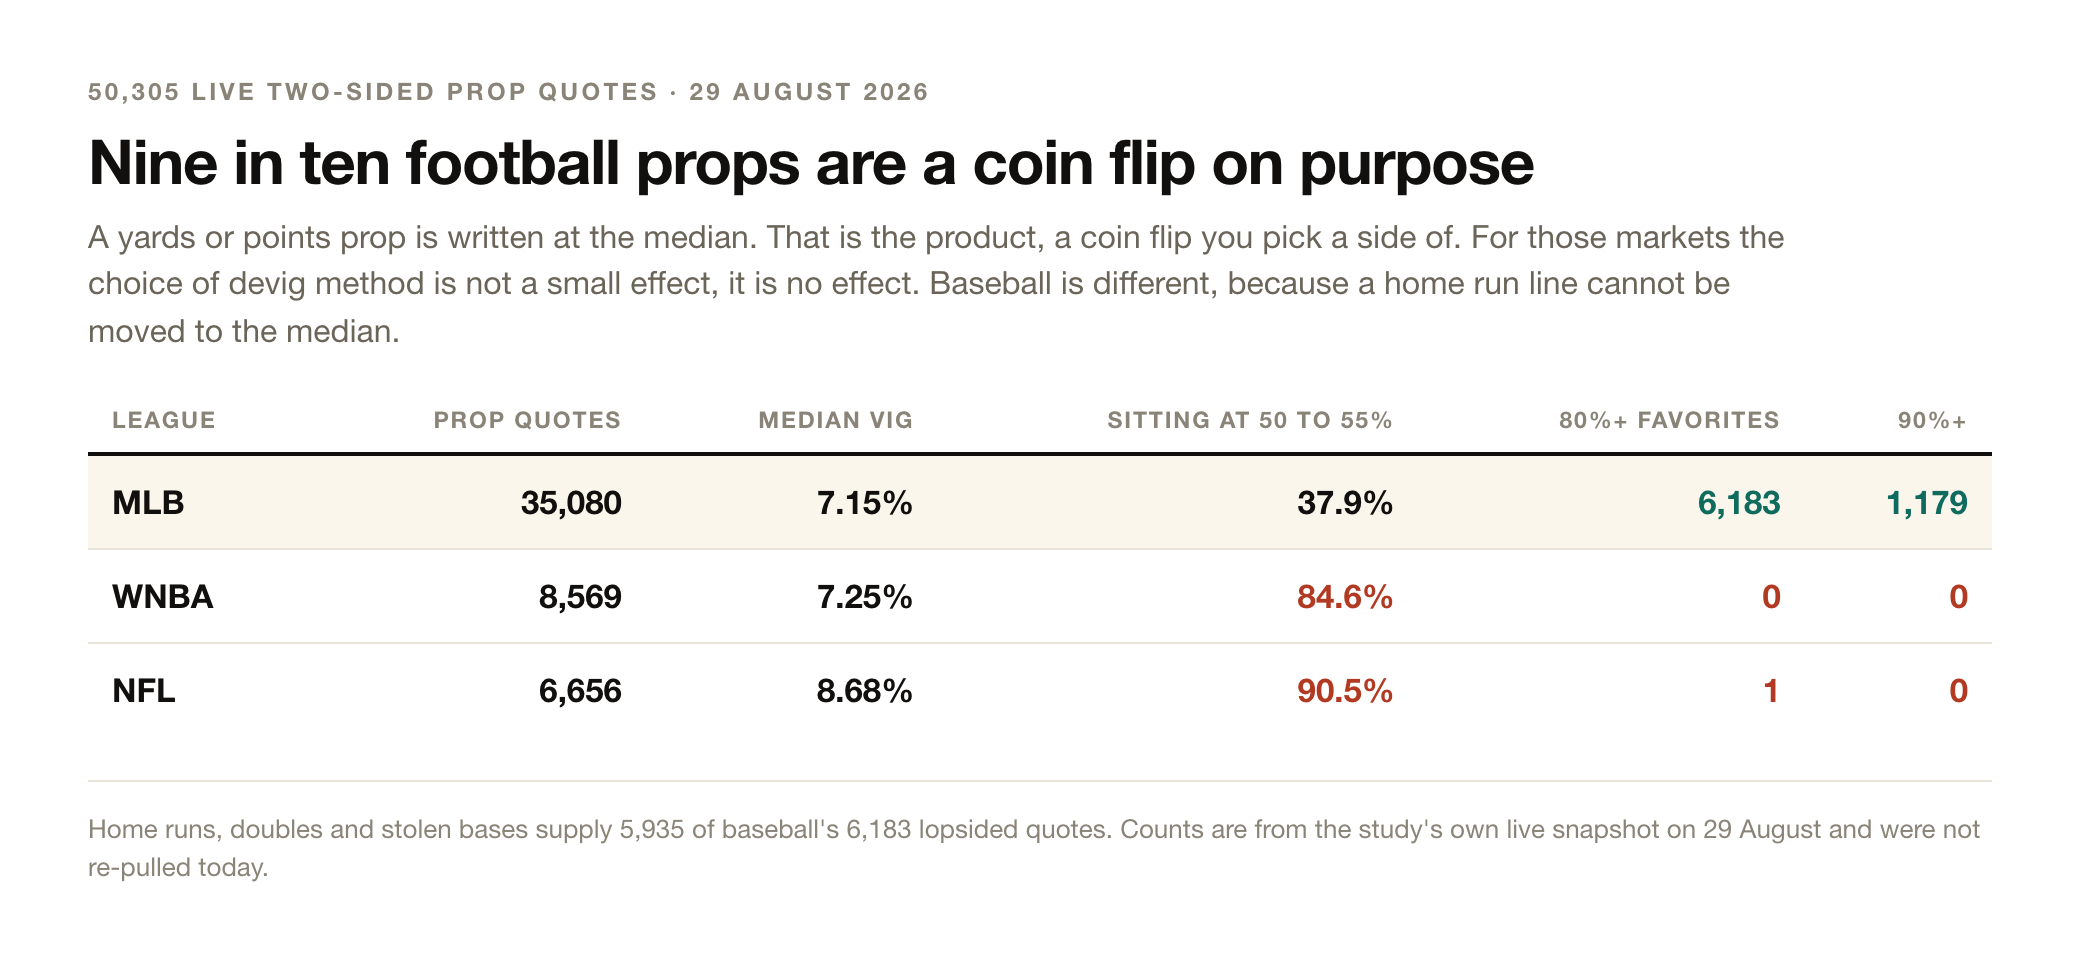
Say the true chance is 10%. The standard devig calls it 13.03%. A bet at a true 10% only turns genuinely profitable above +900. A scanner running the standard math already reports +2% expected value at +683.
Every price between +683 and +900 is one it lights up green and you lose on, and that is the ordinary quoted range for a home run over. Stated as expected value, at +617 the standard method reports -6.6% where the truth is -28.3%, an overstatement of 21.7 points. Across the 8 to 20% band the overstatement runs 8 to 31 points, so any EV threshold below that is not filtering anything.
You can reproduce the break-even side of that on the free implied odds calculator: +900 returns 10.00% and +683 returns 12.77%, so a true 10% shot is a losing bet at every price between them.
When the method makes no difference at all
It would be easy to stop at the finding and oversell it, so here is the counterweight, measured on the same data.
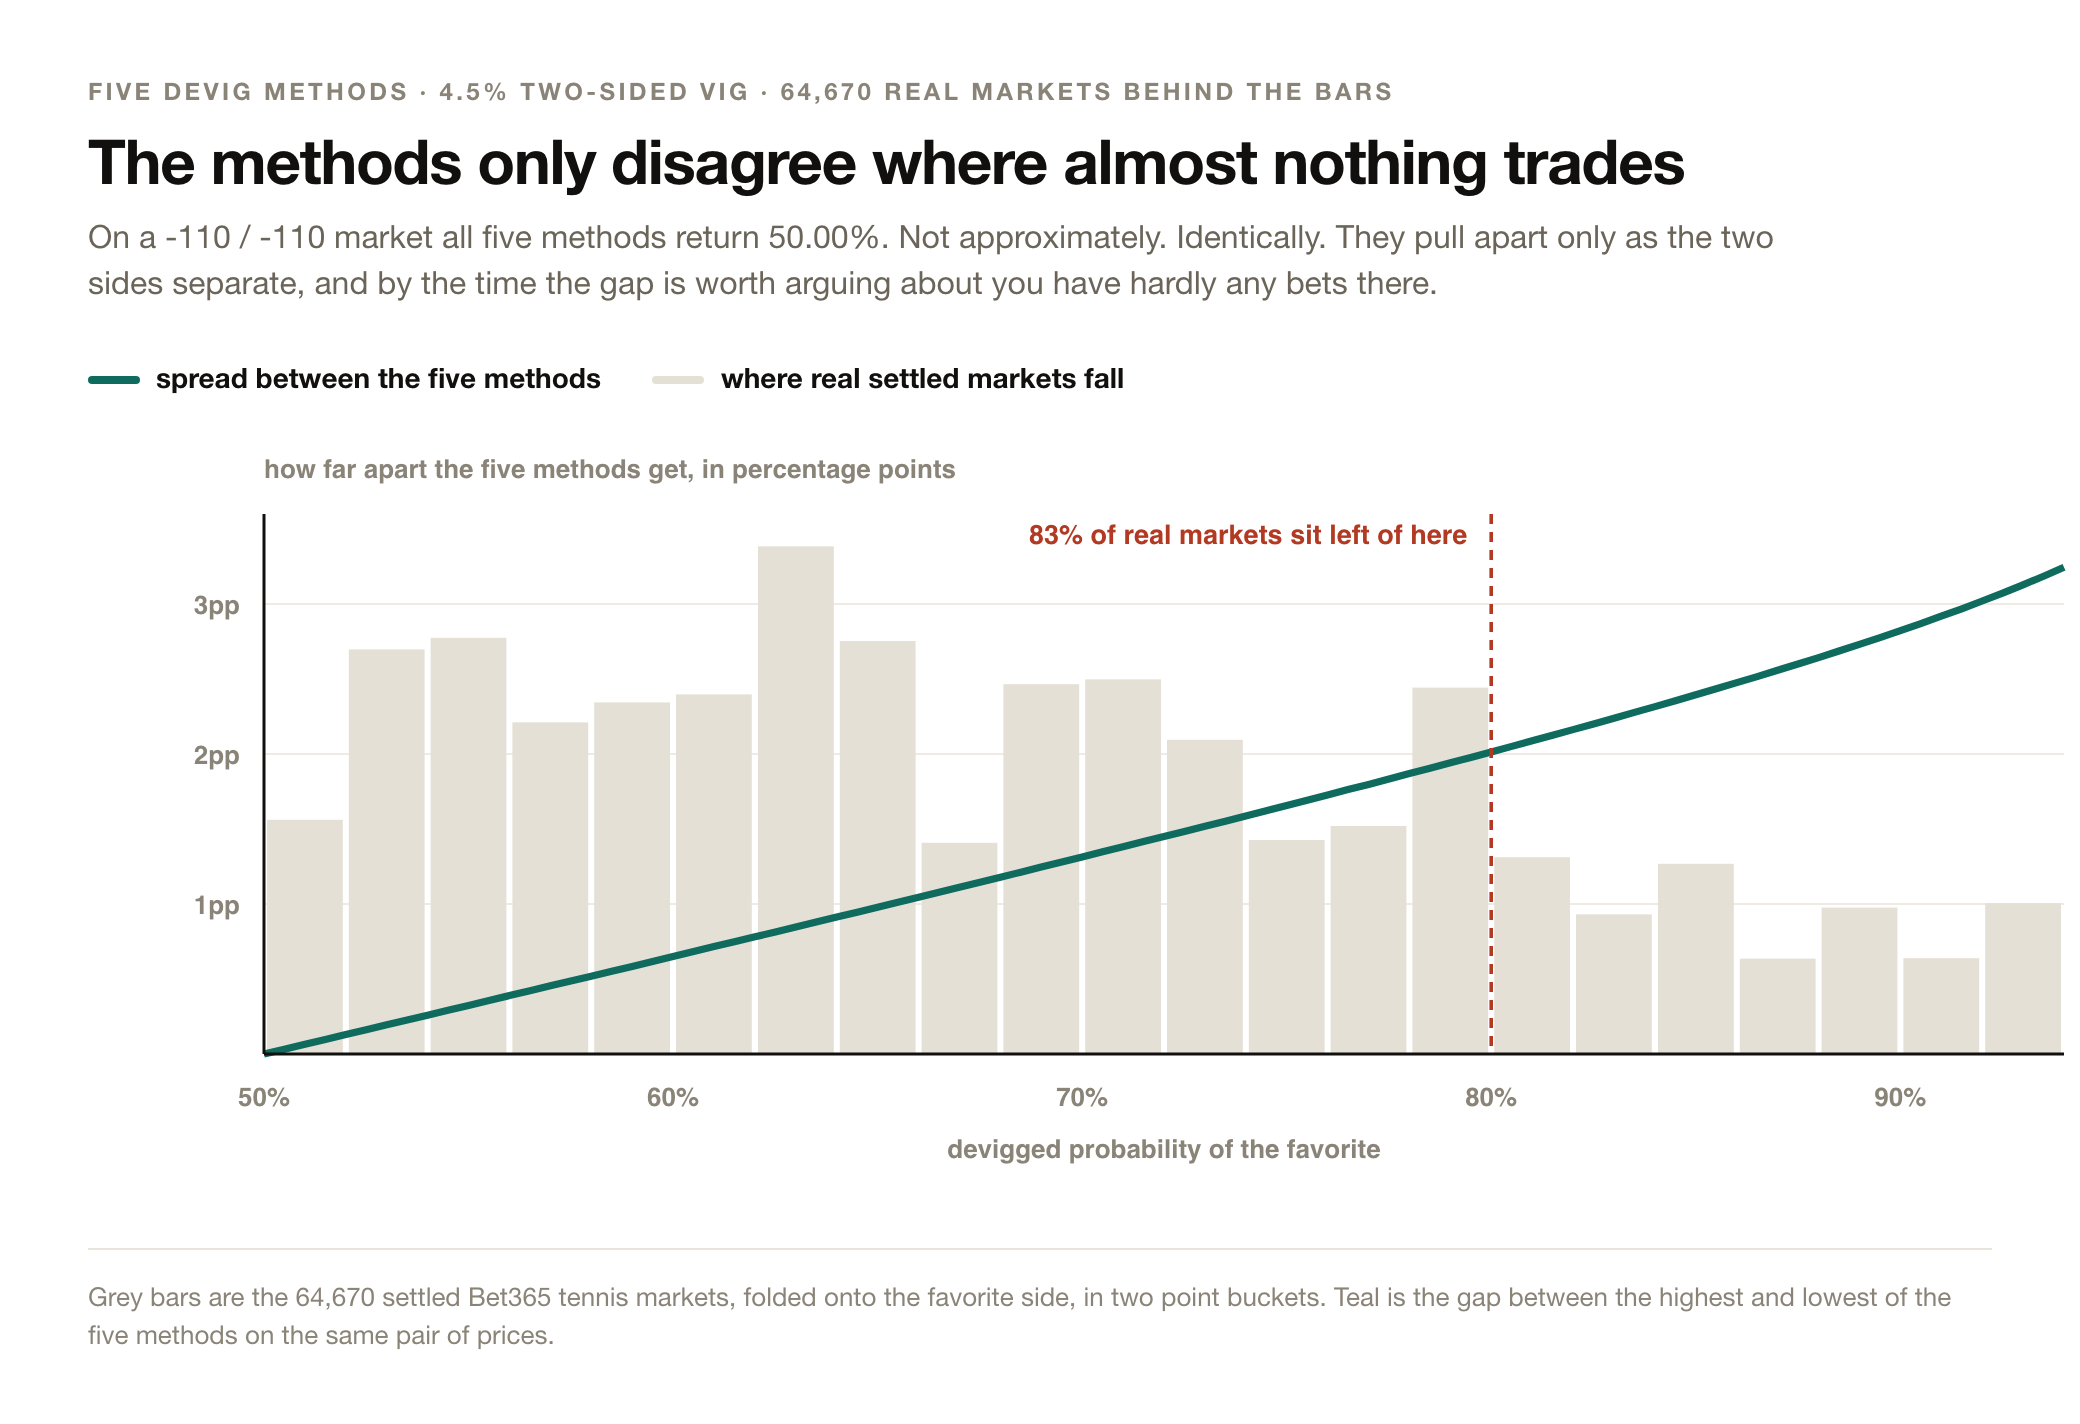
The five methods separate only as the two sides of a market pull apart, and the separation grows roughly with the favorite's price. At a 60% favorite they sit 0.5 points apart. At a 94% favorite, 2.5 points. And 83% of real settled markets fall below an 80% favorite.
So for most of what most people bet, choosing a devig method is a decision with no consequence. The argument only earns its keep on the lopsided tail.
What each method returns on the same market
| -110 / -110 | All five methods return 50.00%. Spread 0.00pp | |
|---|---|---|
| -200 / +165 | Multiplicative 63.86%, probit 64.49%, power 64.78%. Spread 0.92pp | |
| -600 / +440 | Multiplicative 82.23%, probit 83.69%, power 84.39%. Spread 2.15pp | |
| -1000 / +650 | Multiplicative 87.21%, probit 88.93%, power 89.77%. Spread 2.57pp |
Which method to actually use
The finding that survives is about multiplicative, not a coronation of a winner. Additive, odds-ratio and probit land within a point of the truth and are statistically indistinguishable from each other. Power applies the largest correction, which makes it best when the favorite converts and worst when a retirement hands the underdog a win it was never priced for.
Two of them are not even separate methods here. On a two-outcome market the Shin estimator is degenerate and lands exactly on additive, agreeing to within 0.00002%. Any comparison that lists Shin and additive as separate rows on two-way markets is reporting the same number twice.
Separating probit from odds-ratio is not a judgment call, it is impossible. They differ by 0.05 points at a 90% favorite, and telling them apart would take roughly 4.6 million settled markets. Nobody should argue for one over the other on empirical grounds.
The practical answer: keep using the standard method near even money, where it is exact and free. Use a tail-aware method past an 80% favorite. The fair price behind the +EV optimizers already computes one. Scored against 5,242 live two-sided quotes it reproduces probit to within 2.5 x 10 to the minus 10, which is solver tolerance rather than a difference in model.
What this does not tell you
No settled US prop was graded here. The extension from tennis to baseball props rides on the vig-scaling law, which was verified against 1,688 real settled markets at the 6.0 to 7.5% vig props trade at. It assumes props behave like other two-way markets at the same vig. Grading actual props would close that gap and nothing cheaper will.
Closing prices only. Tennis-data publishes closing odds, so this measures a devig applied to a settled market. A devig applied to an early or live price inherits that price's own error on top of the method's.
The source book probably matters more than the method. Pinnacle devigged the standard way will very likely beat a soft book devigged perfectly. Which books feed a fair price is plausibly a bigger lever than which formula removes the vig from them, and that is a separate study.
A calibration win is not an edge. Being more accurate at an 85% favorite is worth money only if you actually bet there. Weight the verdict by where your own bets land, or you will crown a method that wins in a corner nobody visits.
Frequently asked questions
What is the most accurate devig method?
On 64,670 settled two-way markets, additive, odds-ratio and probit all land within about a point of the true hit rate and cannot be separated from each other. The standard multiplicative method is the clear worst, understating heavy favorites by 1.71 to 2.71 points. Power applies the largest correction and leads or trails depending on whether retirements are counted.
What is wrong with the multiplicative devig?
It removes margin in proportion to price, so a heavy favorite gives up too much of the vig and the longshot keeps too much. The result is one-directional: it understates favorites and overstates longshots. On a longshot that means it reports expected value that does not exist, by 8 to 31 points across the 8 to 20% probability band.
Does the devig method matter for NFL or WNBA player props?
Almost never. 90.5% of NFL prop quotes and 84.6% of WNBA prop quotes sit between 50% and 55%, where every method returns the same number to within a hundredth of a point. Continuous-stat props are written at the median on purpose. The method only matters on discrete-count baseball markets like home runs, doubles and stolen bases.
Is the free no-vig calculator wrong?
No, and it is exact on the markets most people use it for. It runs the standard multiplicative method, which returns the correct answer on an even market and stays close through about an 80% favorite. Past that it drifts, and on a longshot at fat vig it overstates. Use it for game lines and normal props, and treat a +700 quote with more care.
How much does the error grow with the vig?
Holding the favorite band at 80 to 95%, multiplicative's error runs 0.80 points at 1.5 to 3.0% vig, 1.67 at 3.0 to 4.5%, 1.84 at 4.5 to 6.0%, and 2.26 at 6.0 to 7.5%. Baseball props trade at 6.4 to 8.7% vig, which is the worst band measured.