Are Unders Better Than Overs on Player Props?
By Matt Downs · August 25, 2026
Bettors have argued about this for as long as player props have existed. The claim is that unders are the sharper side, because the public likes backing a player to do the thing and books shade the over to match.
It is a claim that can be counted rather than argued about. Our prop optimizer picks legs off the DFS board every night by one criterion, whether the devigged price says the row is worth taking, and it has no opinion about which arrow it ends up with. So the arrows it produces are a measurement.
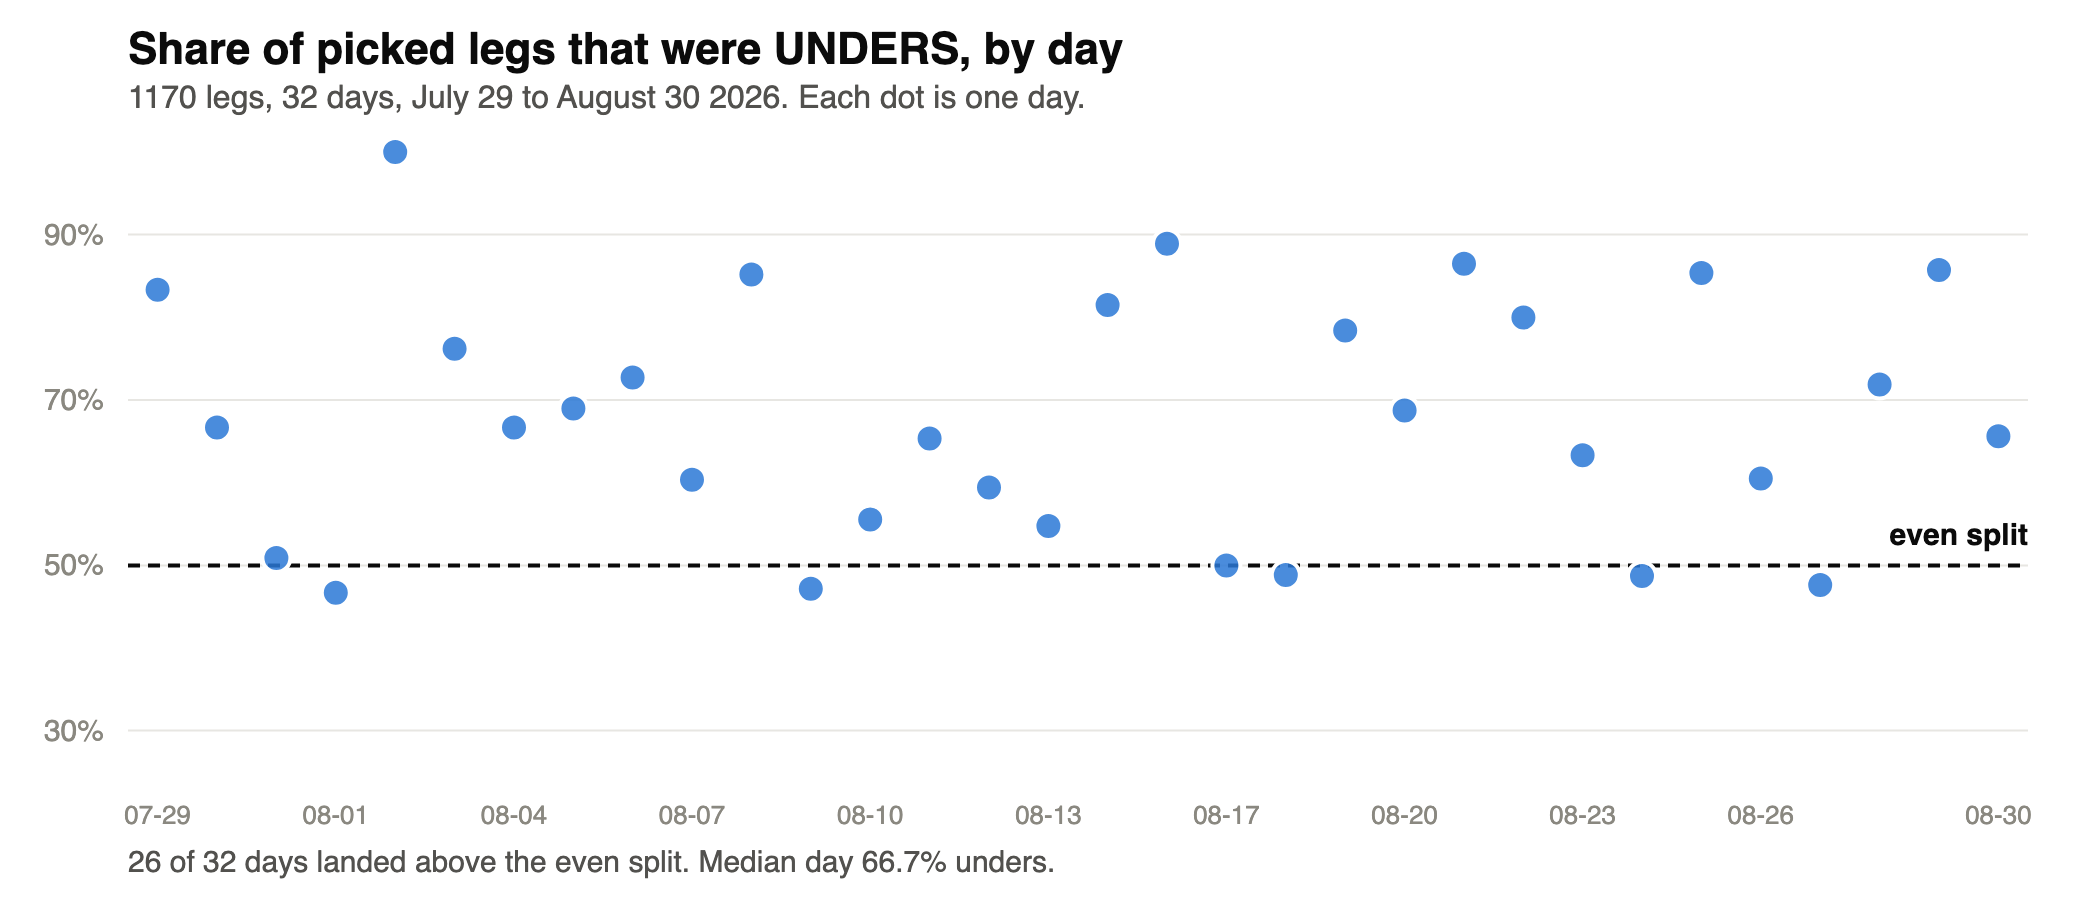
The count: 65.0% of picked legs were unders
Across 1,170 legs the optimizer selected between July 29 and August 30 2026, 760 were unders and 410 were overs. That is 65.0%.
It is not one lopsided night carrying the average either. 26 of the 32 days landed above an even split, and the median day ran 66.7% unders. The days that did not clear even sat close to it rather than reversed.
A second and independent signal points the same way. Among legs that qualified on tracked whale money, meaning real size had already gone through at that price or better, 111 were unders and 61 were overs. That is 65%, from a different detector than the one that produced the main count.
The unders were not better bets
Here is the finding that changes what you should do with the count. Each picked leg carries the tool's devigged read on how often it should land. Averaged across the whole sample, the unders came out at 54.81% and the overs at 54.80%.
That is one hundredth of a point apart on 1,170 legs, which is the same number. The lean is in how many rows clear, and it is absent from how much they clear by. A picked over is worth what a picked under is worth.
So the practical use of the count is narrow. It tells you which side of a board tends to hold more of the rows worth checking. It does not license taking an under because it is an under.
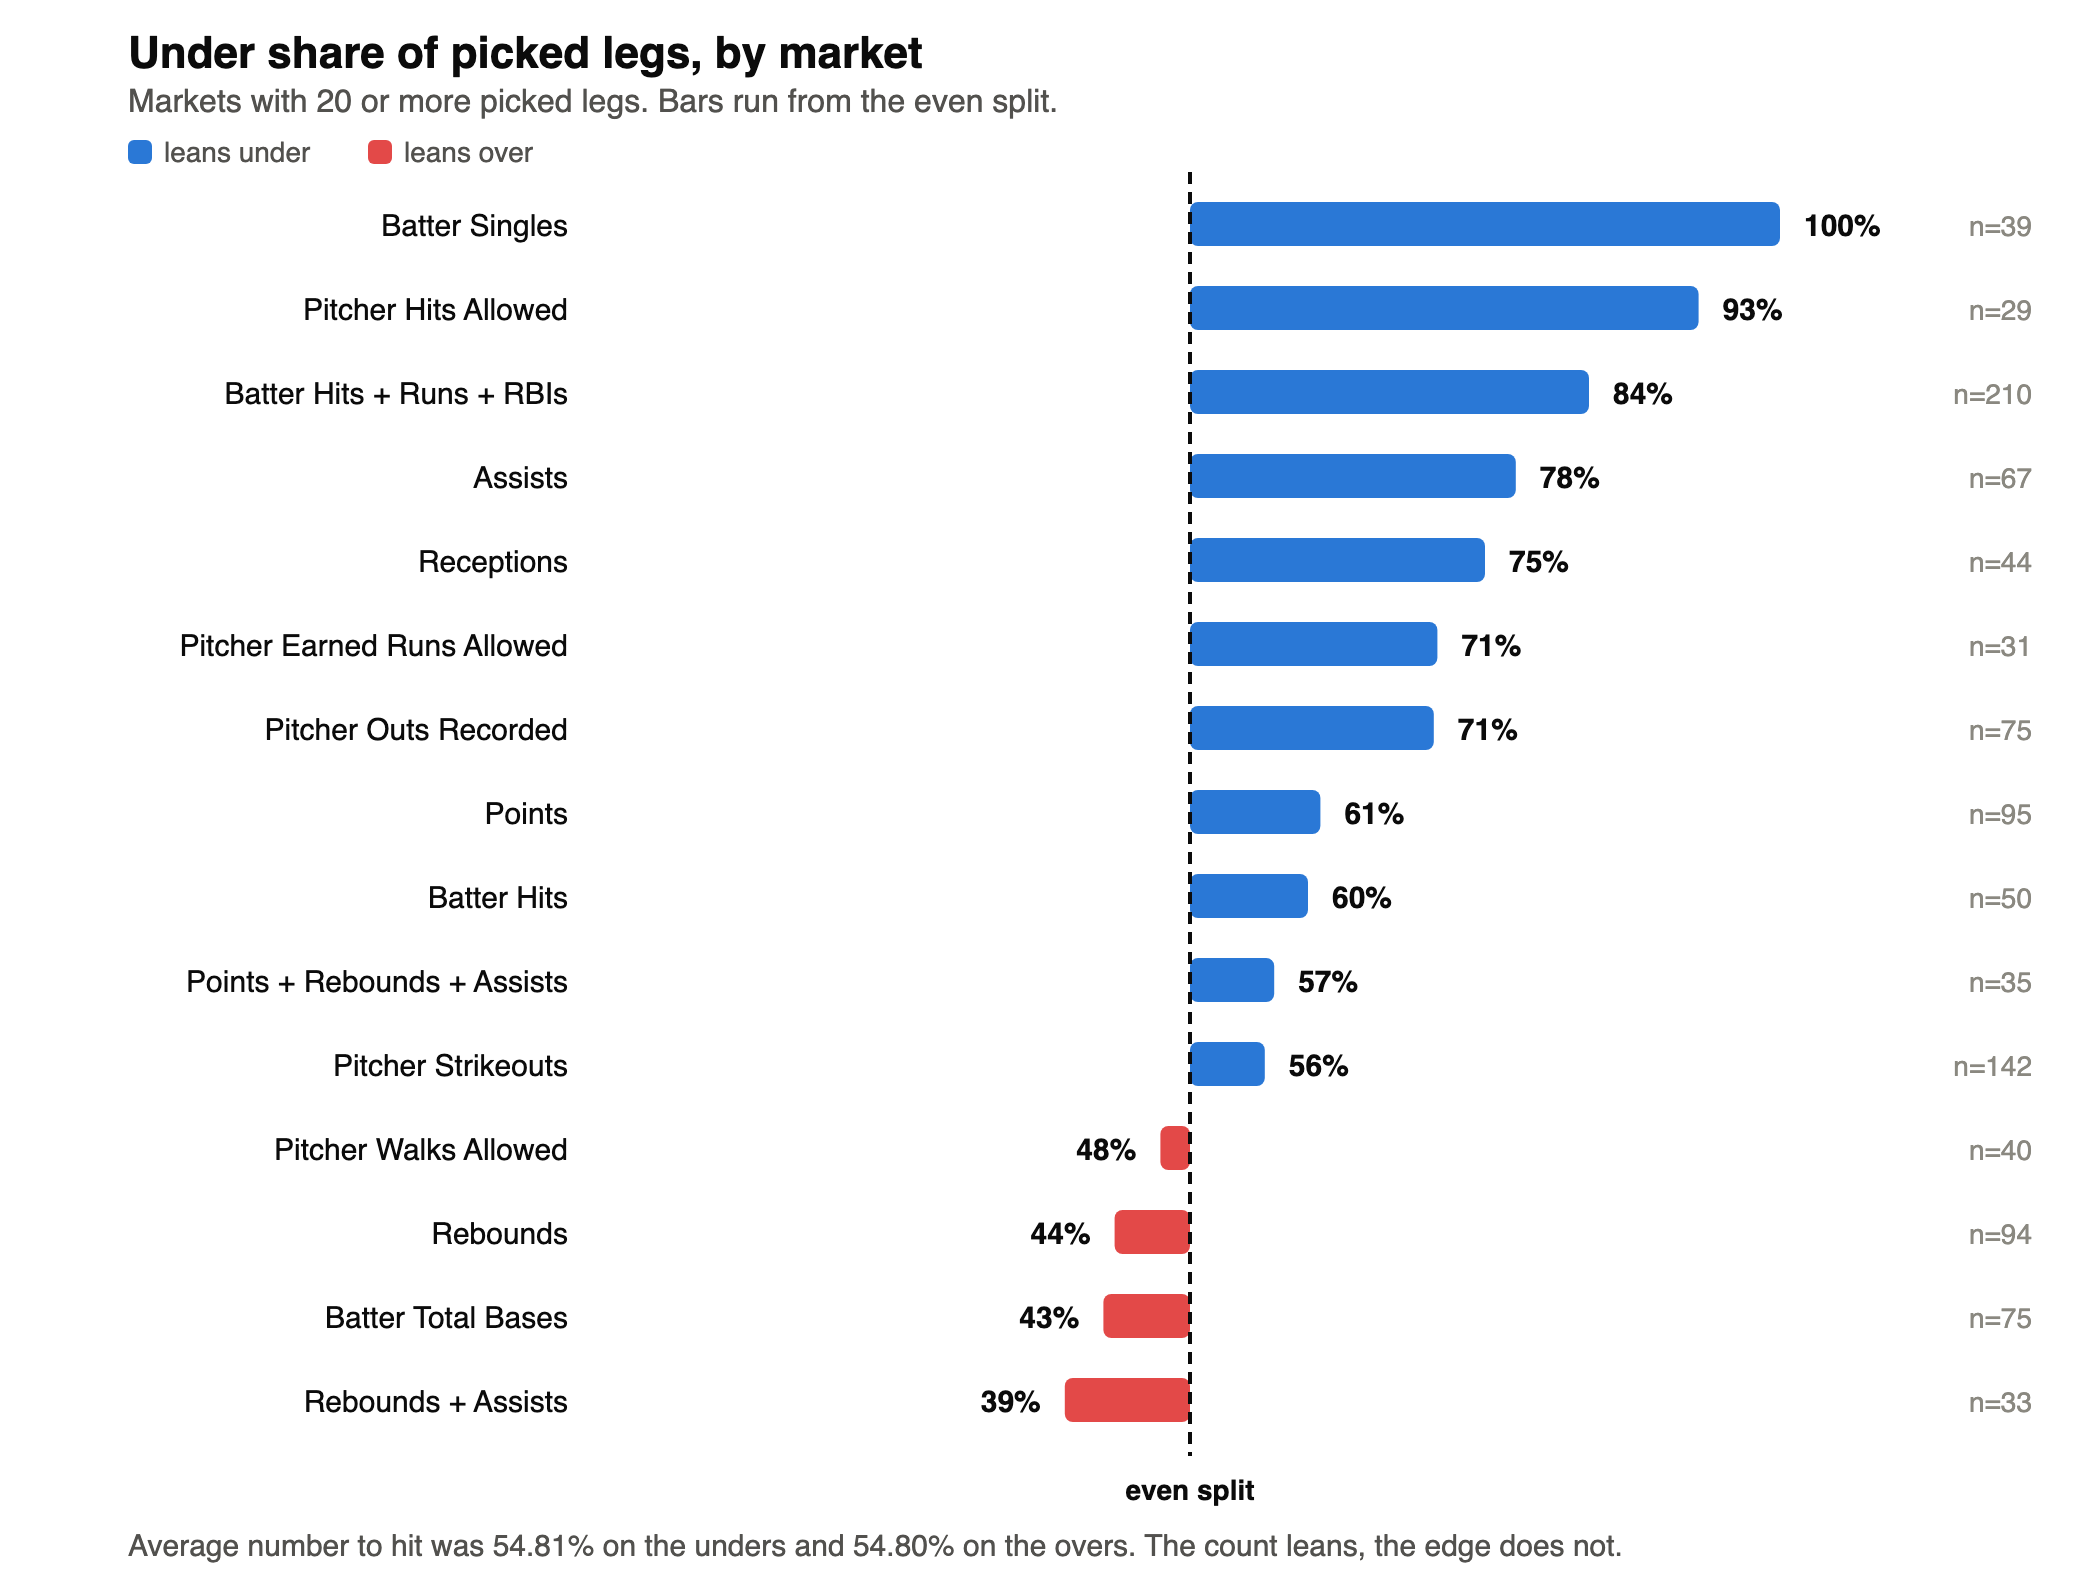
It is a market-level effect, not a board-level rule
Broken out by prop market, the tidy version falls apart. Batter singles ran 100% unders on 39 legs and pitcher hits allowed ran 93% on 29. Batter hits plus runs plus RBIs ran 84% on 210, assists 78% on 67, and receptions 75% on 44.
Then rebounds plus assists came in at 39% on 33 legs, batter total bases at 43% on 75, rebounds at 44% on 94, and pitcher walks allowed at 48% on 40. Those are the same nights and the same board.
By league it splits again. MLB legs ran 70.5% unders across 723 picks while WNBA legs ran 56.2% across 363. About 62% of the whole sample is baseball, so baseball is most of what the headline number is measuring.
Under share by market, picked legs, 32 days
| Batter singles (n=39) | 100% under | |
|---|---|---|
| Pitcher hits allowed (n=29) | 93% under | |
| Batter hits + runs + RBIs (n=210) | 84% under | |
| Assists (n=67) | 78% under | |
| Receptions (n=44) | 75% under | |
| Pitcher outs recorded (n=75) | 71% under | |
| Points (n=95) | 61% under | |
| Pitcher strikeouts (n=142) | 56% under | |
| Pitcher walks allowed (n=40) | 48% under | |
| Rebounds (n=94) | 44% under | |
| Batter total bases (n=75) | 43% under | |
| Rebounds + assists (n=33) | 39% under |
The lean is a property of the board, so it moves when the board does
The strongest argument against turning this count into a rule is what happened inside the sample itself. Football arrived in the last week of it. College football legs came in at 70.4% unders on 54 picks, and the eight NFL legs captured so far ran the other way at 12.5%.
Both of those are young samples and neither settles anything on its own. They are enough to make the point that matters: nothing in the tool changed when the sport did. The board changed, and the mix of arrows changed with it.
A bettor who turned last month's 65% into a standing preference for unders would be carrying a baseball habit into a football season, with no mechanism to notice. The check on the individual row survives the calendar. The count does not.
The check that replaces picking a side
DFS pick'em apps price every leg the same. PrizePicks charges a flat -119 whichever side you take, and -119 needs 54.34% to break even, which you can confirm on the implied odds calculator. A six leg flex needs roughly 54.2% per leg.
So the question on any row is whether the devigged market price puts it above that line. The board captured at 18:30 UTC on August 30 2026 held 38 rows, and the six leg card the optimizer built off it came out three overs and three unders.
Ranked in the order the tool produced them, those rows read 54.86%, 54.67%, 54.47%, 54.25%, 54.08% and 53.96%, and the top row is an over. The sixth sits below the 54.2% a six leg flex needs, and it went in because a six leg card has to be filled. The arrow each row happened to point was a consequence rather than a reason.
What this measurement cannot tell you
Three limits belong with the number. First, these are the legs the tool picked, so the sample is what cleared a price threshold rather than a census of every prop posted. A full board census would be a different and larger study, and the capture table does not store the rows that were rejected.
Second, it counts prices and not outcomes. Nothing here is a win rate, and no claim is made that these legs won.
Third, the per-leg percentages are the tool's own devigged consensus figures. The captures store one side of each book's quote, so those figures were not independently re-derived here, and no single book's price is presented as an edge on its own.
Frequently asked questions
Are unders better than overs on player props?
Not in edge. Across 1,170 optimizer-picked legs measured over 32 days, unders averaged 54.81% to hit and overs averaged 54.80%, which is one hundredth of a point apart. Unders were more numerous among rows worth taking, at 65.0%, but a picked over was worth as much as a picked under.
Why do more unders show up as good bets?
The usual explanation is that recreational money prefers backing a player to exceed a number, so the over gets shaded and the under is left alone. That mechanism is not proven by this data, which measures where the prices ended up rather than why.
Does the under lean apply to every prop market?
No. Over the same 32 days, batter singles ran 100% unders and pitcher hits allowed ran 93%, while rebounds plus assists ran 39% and batter total bases ran 43%. The effect is market-specific, MLB carries far more of it than the WNBA, and the football legs captured so far do not agree with each other yet.
What number does a PrizePicks leg have to beat?
PrizePicks prices every leg at a flat -119, which implies 54.34% break-even. A six leg flex needs about 54.2% per leg. Any row whose devigged market probability sits above that line is worth taking regardless of which side it is.